Set-up Grafana integration
Before setting up Grafana integration, ensure you have set up the Aidbox Metrics Server. Check the guide below on how to do it.
Please start a discussion or Contact us us if you have questions, feedback, or suggestions.
Configuration
You need to set up the following environment variables:
| Environment variable | Description |
|---|---|
AIDBOX_BOX_ID | Provided instance name will be attached to metrics labels. Required for monitoring of multiple Aidbox instances. |
BOX_METRICS_GRAFANA_URL | Grafana instance url |
BOX_METRICS_GRAFANA_USER | Grafana user name |
BOX_METRICS_GRAFANA_PASSWORD | Grafana user password |
RPC Methods
Сreated dashboards will be placed in the aidboxgen folder
aidbox.metrics/update-aidbox-dashboard
Generates dashboards with instance-specific metrics
_datasource (Optional) - specify prometheus like datasource name. Default: Prometheus_
_kibana-url (Optional) - specify Kibana base url for generating a drill-down link to Kibana._
status - "200 OK"
error - "Provide following environment variables: BOX_METRICS_GRAFANA_USER, BOX_METRICS_GRAFANA_PASSWORD, BOX_METRICS_GRAFANA_URL"
error - \
Request example
POST /rpc
content-type: application/edn

{:method aidbox.metrics/update-aidbox-dashboard
 :params {:datasource "My Prometheus Datasource name"
          :kibana-url "https://my.kibana.url.com"}}
Grafana Aidbox Dashboard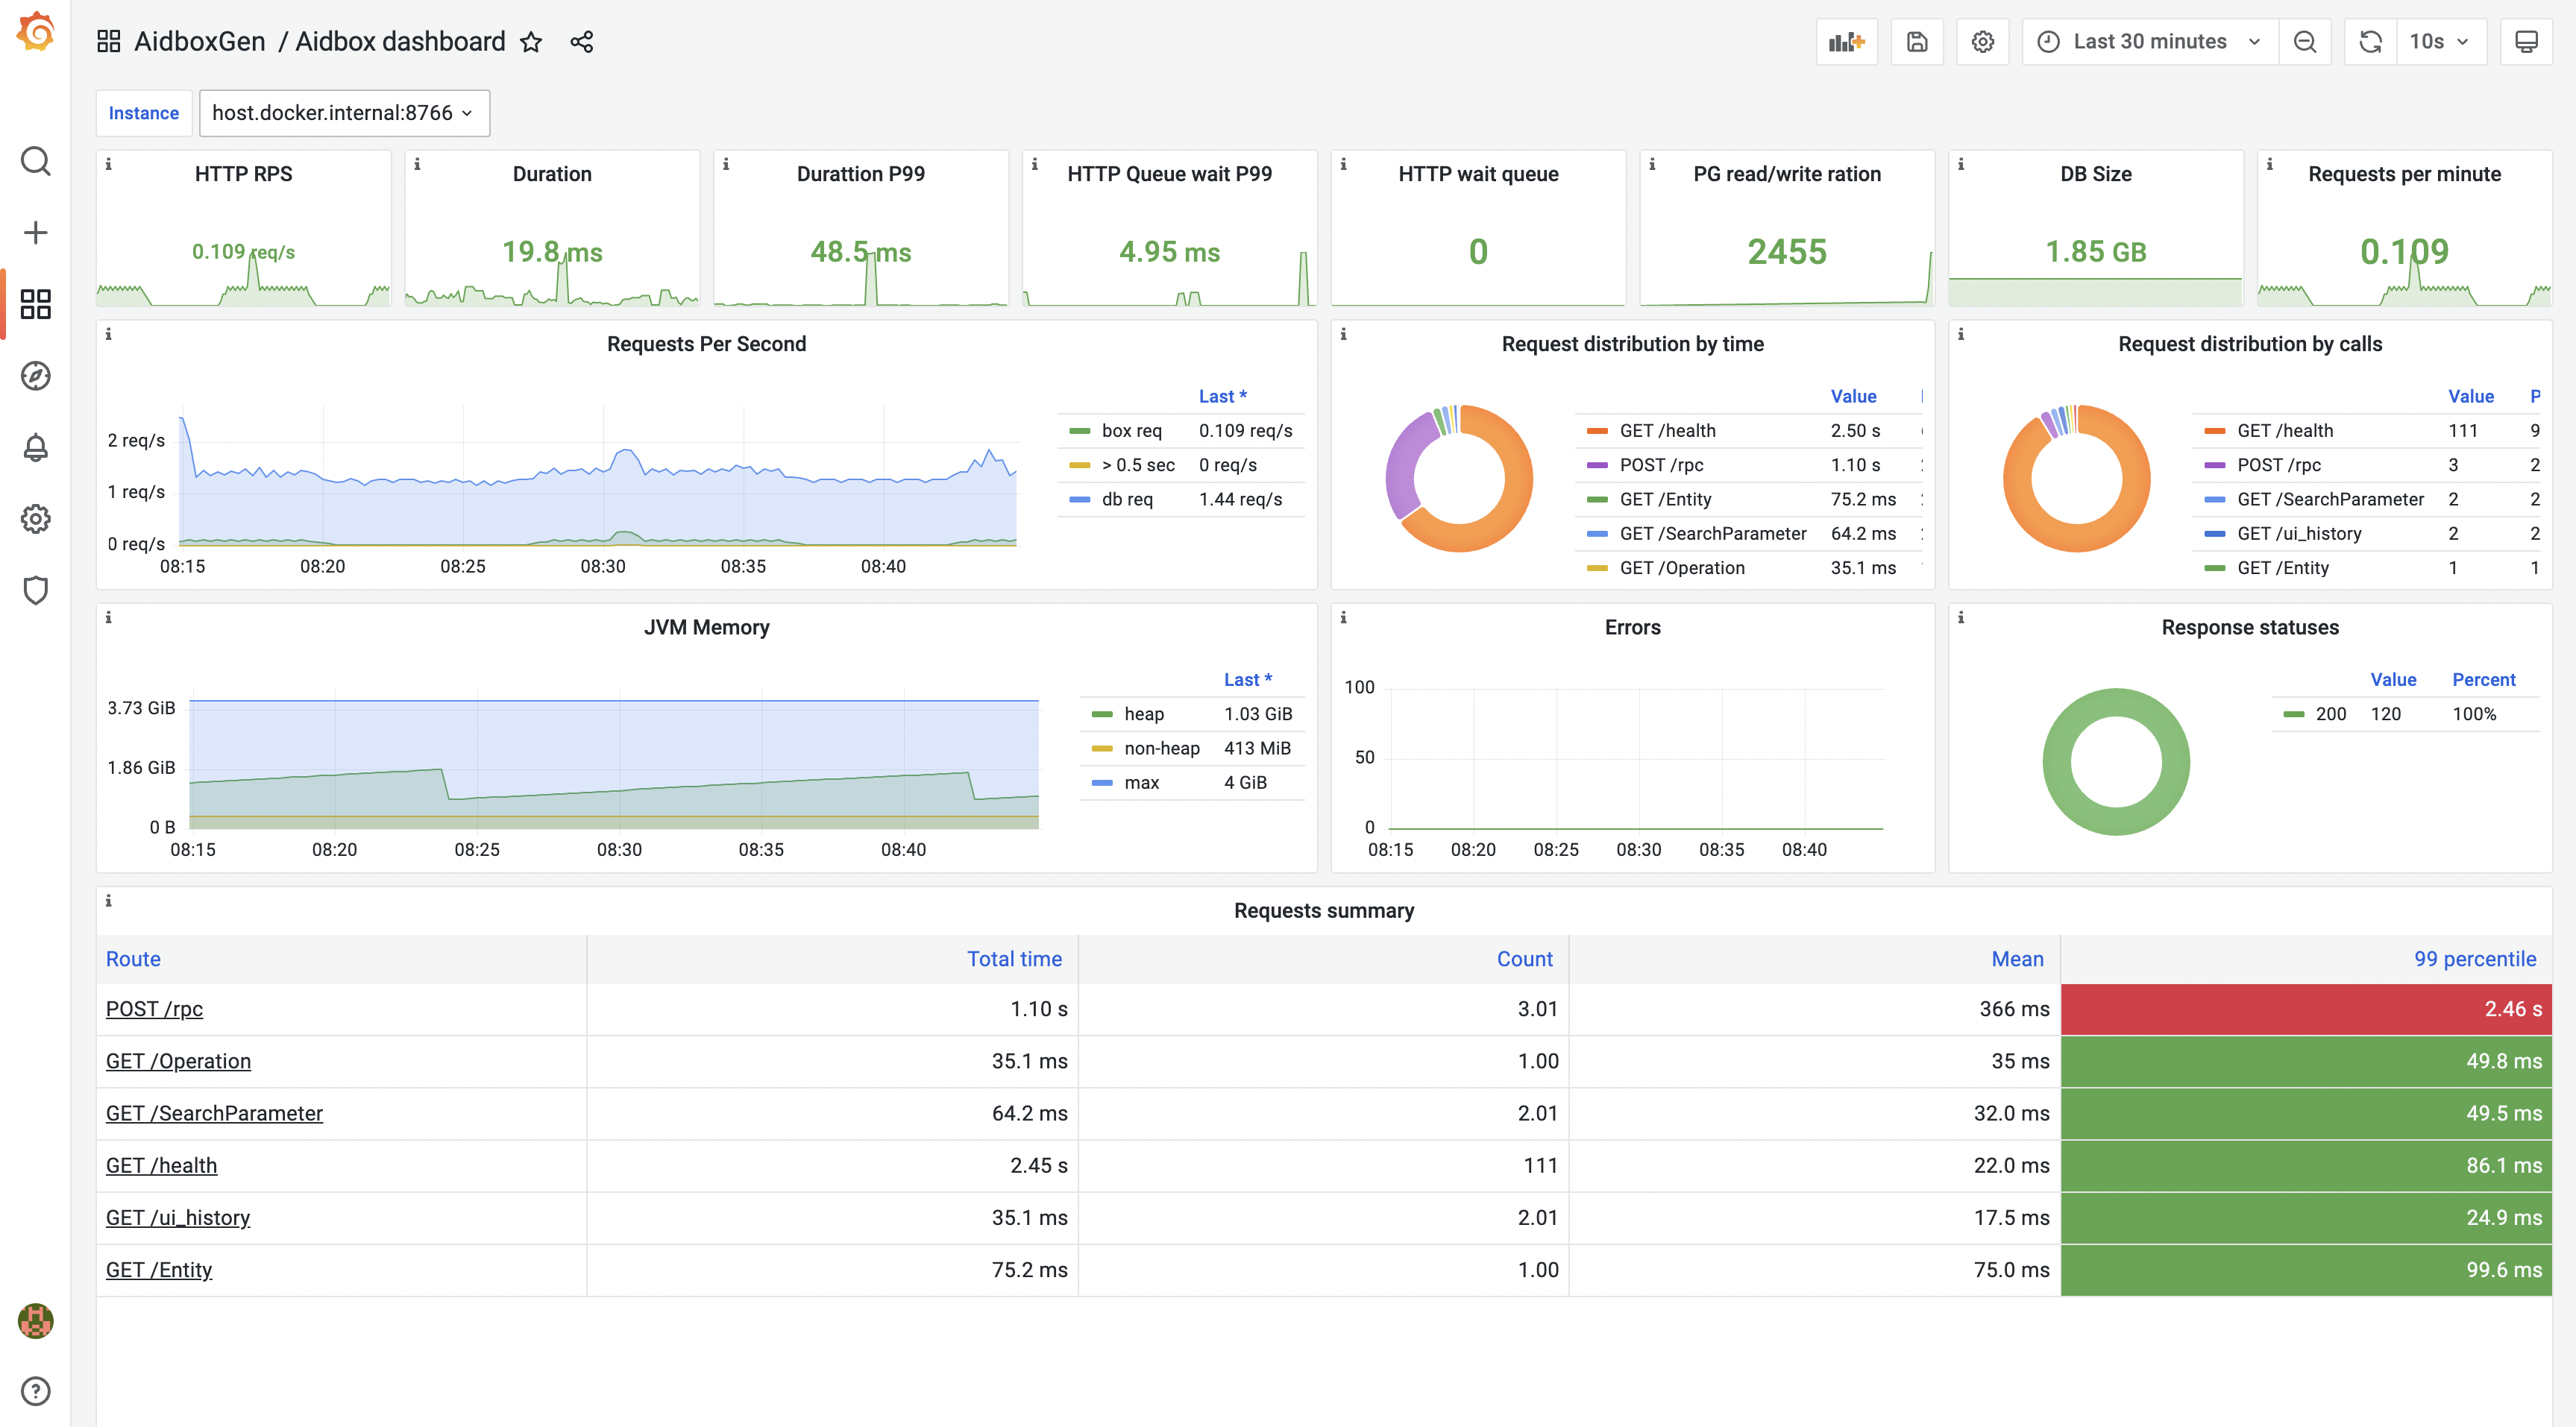
aidbox.metrics/update-cluster-dashboard
Generates dashboards with cluster-specific metrics
status - "200 OK"
error - "Provide following environment variables: BOX_METRICS_GRAFANA_USER, BOX_METRICS_GRAFANA_PASSWORD, BOX_METRICS_GRAFANA_URL"
error - \
Required Prometheus exporters:
kubestatemetricsnodeexportercadvisor
Request example
POST /rpc
content-type: application/edn

{:method aidbox.metrics/update-cluster-dashboard}
aidbox.metrics/get-aidbox-dashboard
Generates dashboards as a JSON
_Expects no parameters_
Grafana dashboard JSON:
{
 "uid": "metrics-dev",
 "title": "Aidbox metrics dev",
 // omitted
}
Required Prometheus exporters:
kubestatemetricsnodeexportercadvisor
Request example
POST /rpc
content-type: application/json
accept: application/json

{"method": "aidbox.metrics/get-aidbox-dashboard"}