Run Aidbox with OpenTelemetry locally
Intro
This guide helps you to launch and explore the Aidbox observability features locally.
It introduces you to:
- The Aidbox installation process with Docker & Docker Compose,
- Logs & metrics & traces exporting to Elasticsearch & Prometheus & Zipkin using OpenTelemetry collector service.
.png)

Please make sure that both Docker & Docker Compose are installed.
Quickstart Guide
1. Get preconfigured example
To get a preconfigured example, clone the Aidbox examples repository and navigate to the OpenTelemetry directory:
git clone git@github.com:Aidbox/examples.git && cd examples/OpenTelemetry2. Start Aidbox with Docker Compose
docker compose up --force-recreateWait until all components are pulled and started.
Navigate to http://localhost:8888/ and Sign In to the Aidbox UI using the login admin and password password.
3. Discover Aidbox logs with Kibana
Kibana should be available on http://localhost:5602 address. To see logs in Kibana we should
- make sure that logs are coming to Elasticsearch and then
- create a data view to observe over logs.
Go to Index Management page in Kibana (Menu → Stack Management → Index Management). You should see aidbox_logs index there.
Index management page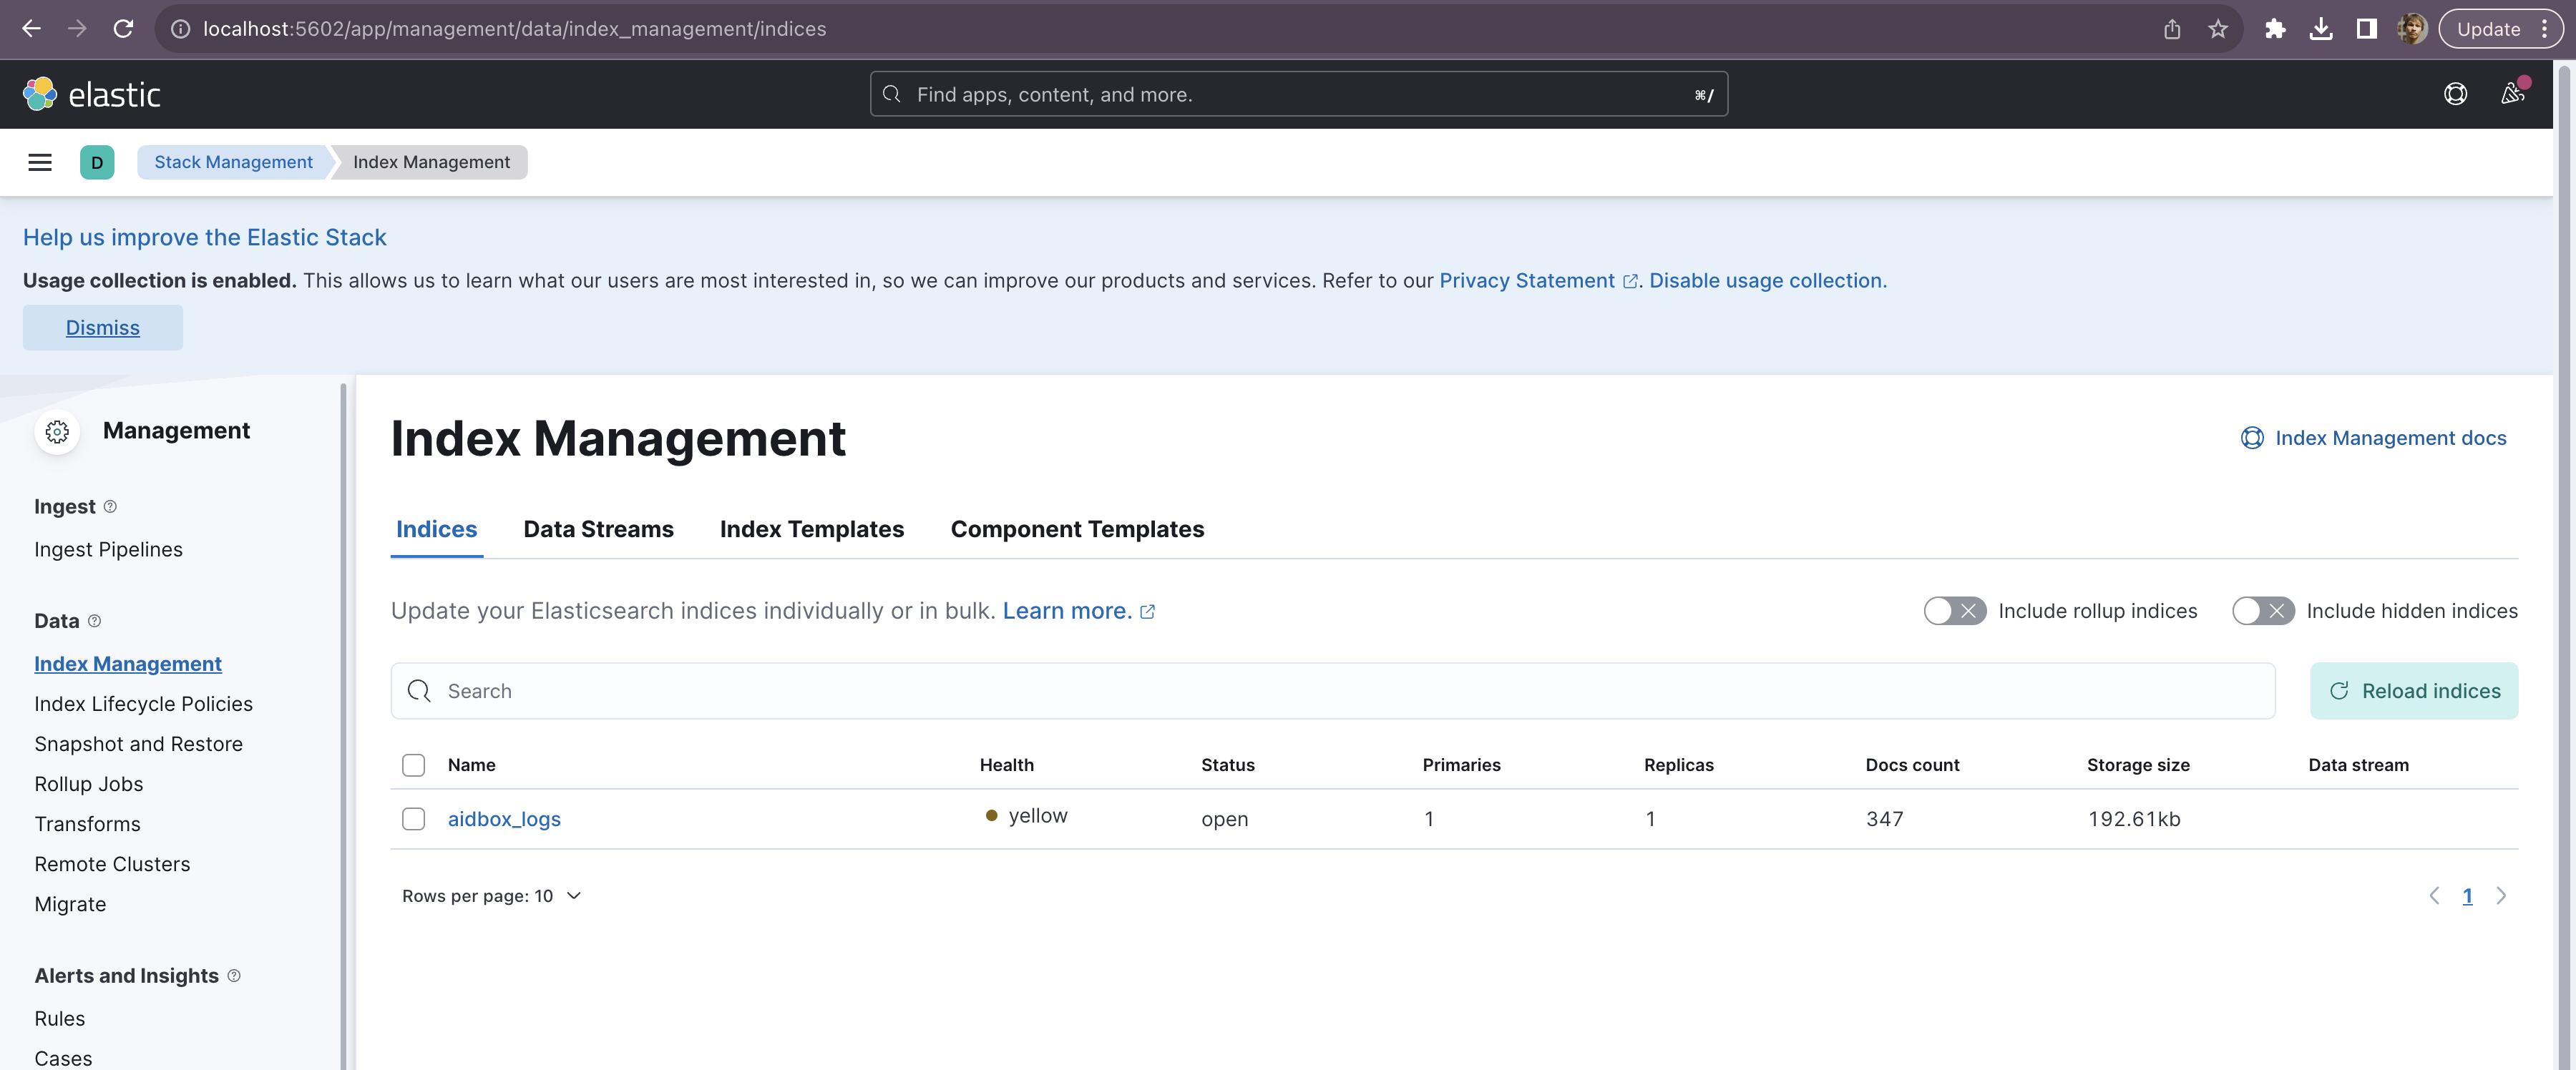
Then we should go to Data Views page (Menu → Stack Management → Data Views) and create a data view there.
Data view creation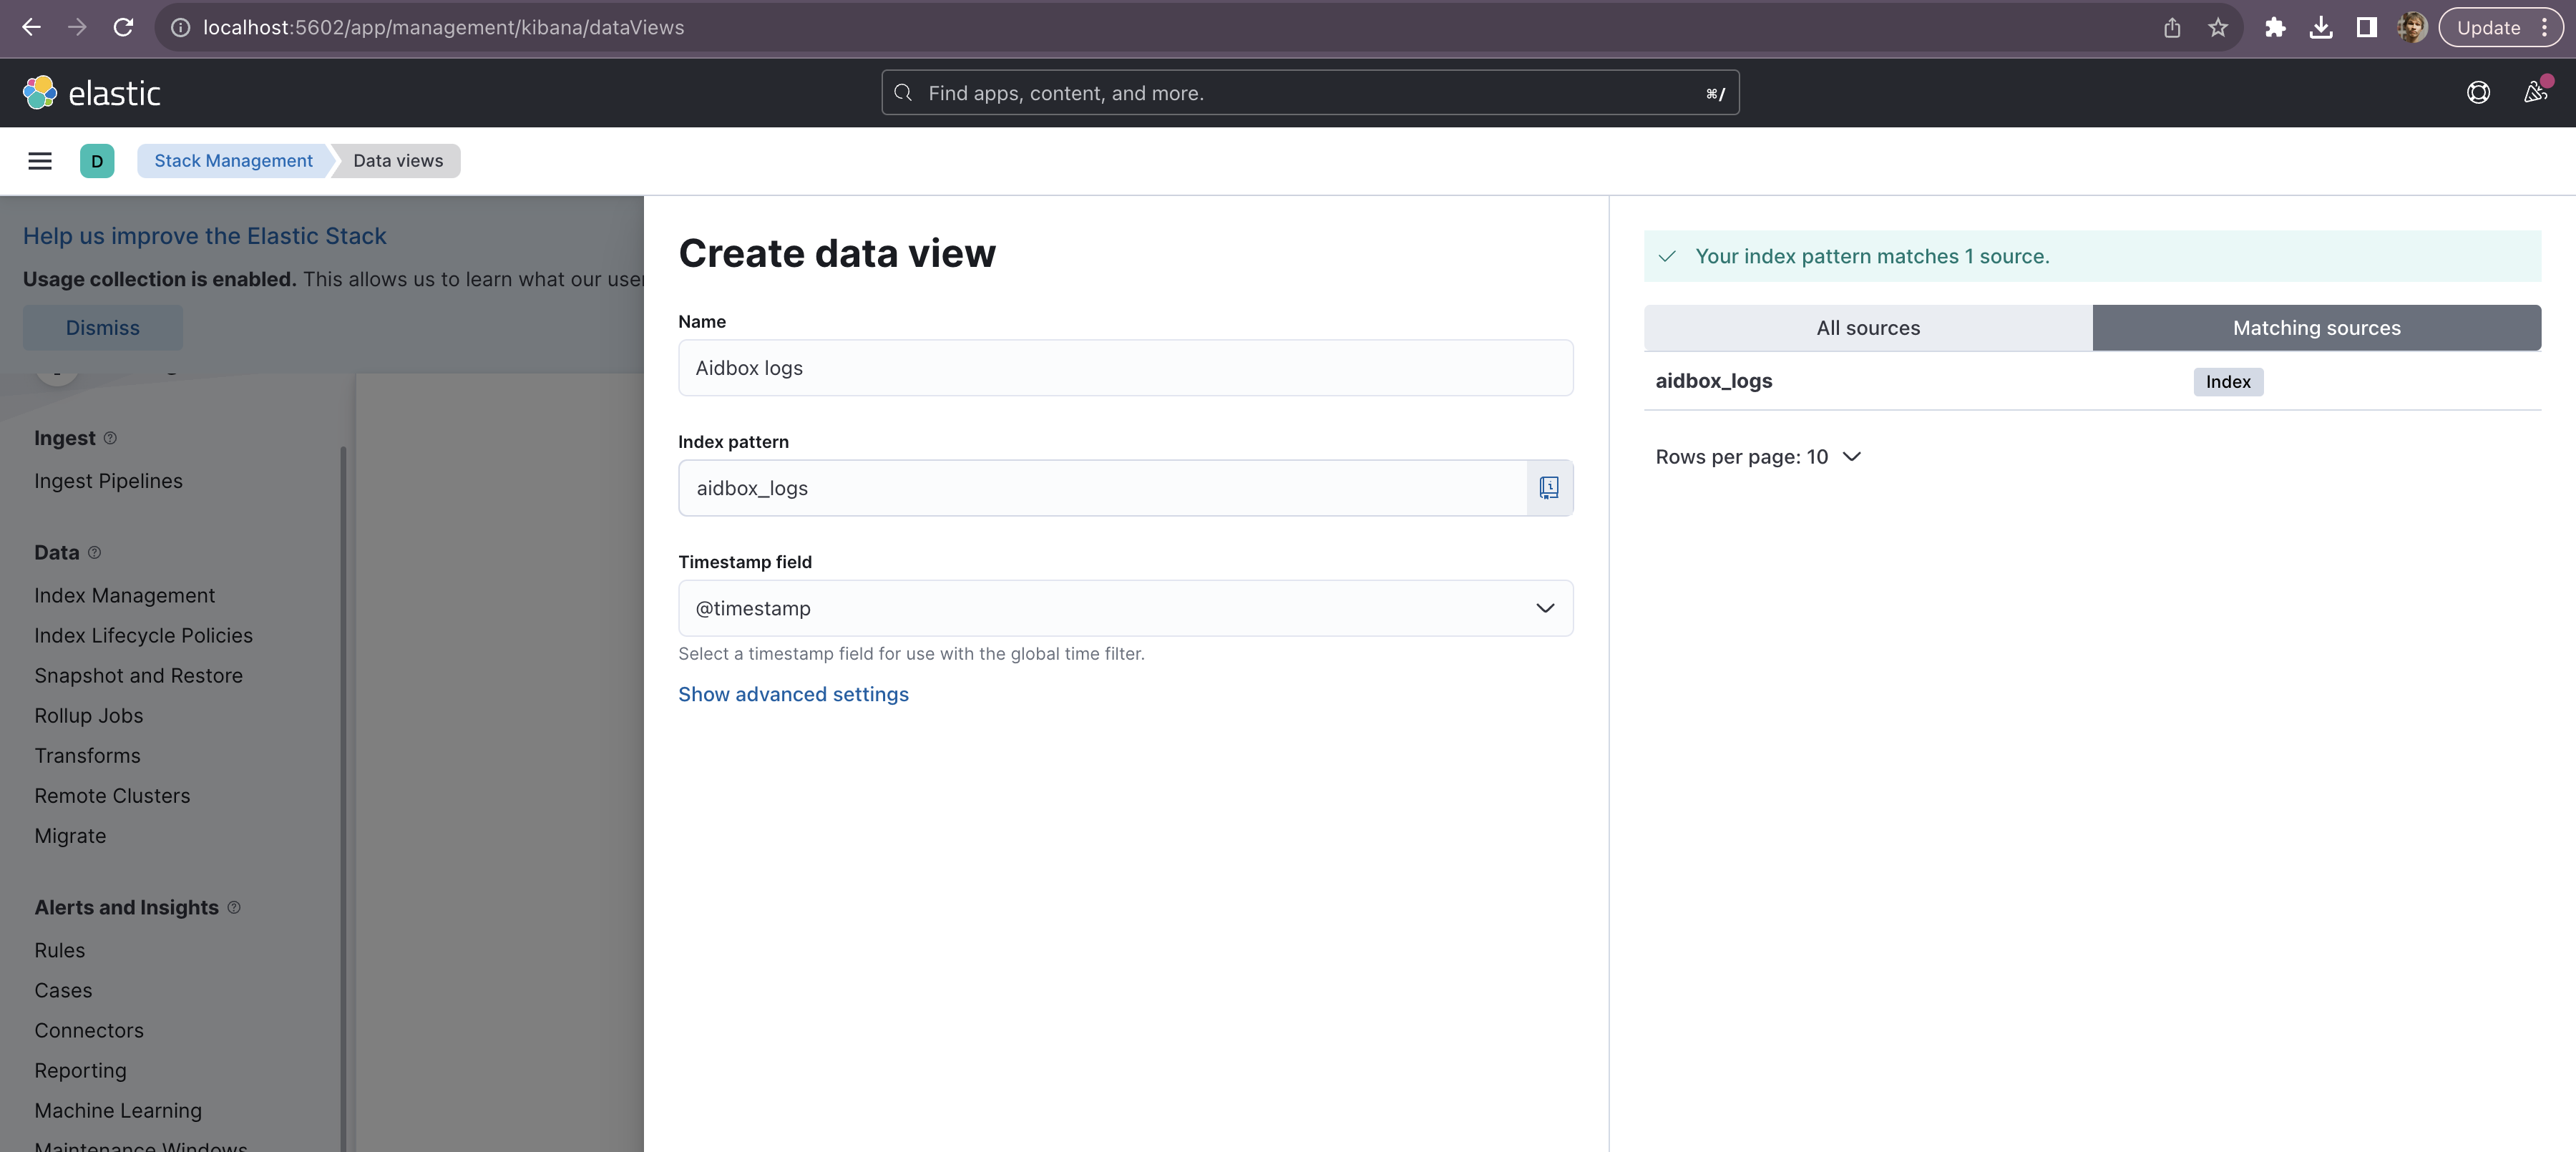
Then go to Discover page (Menu → Discover) and observe your logs.
Log discover page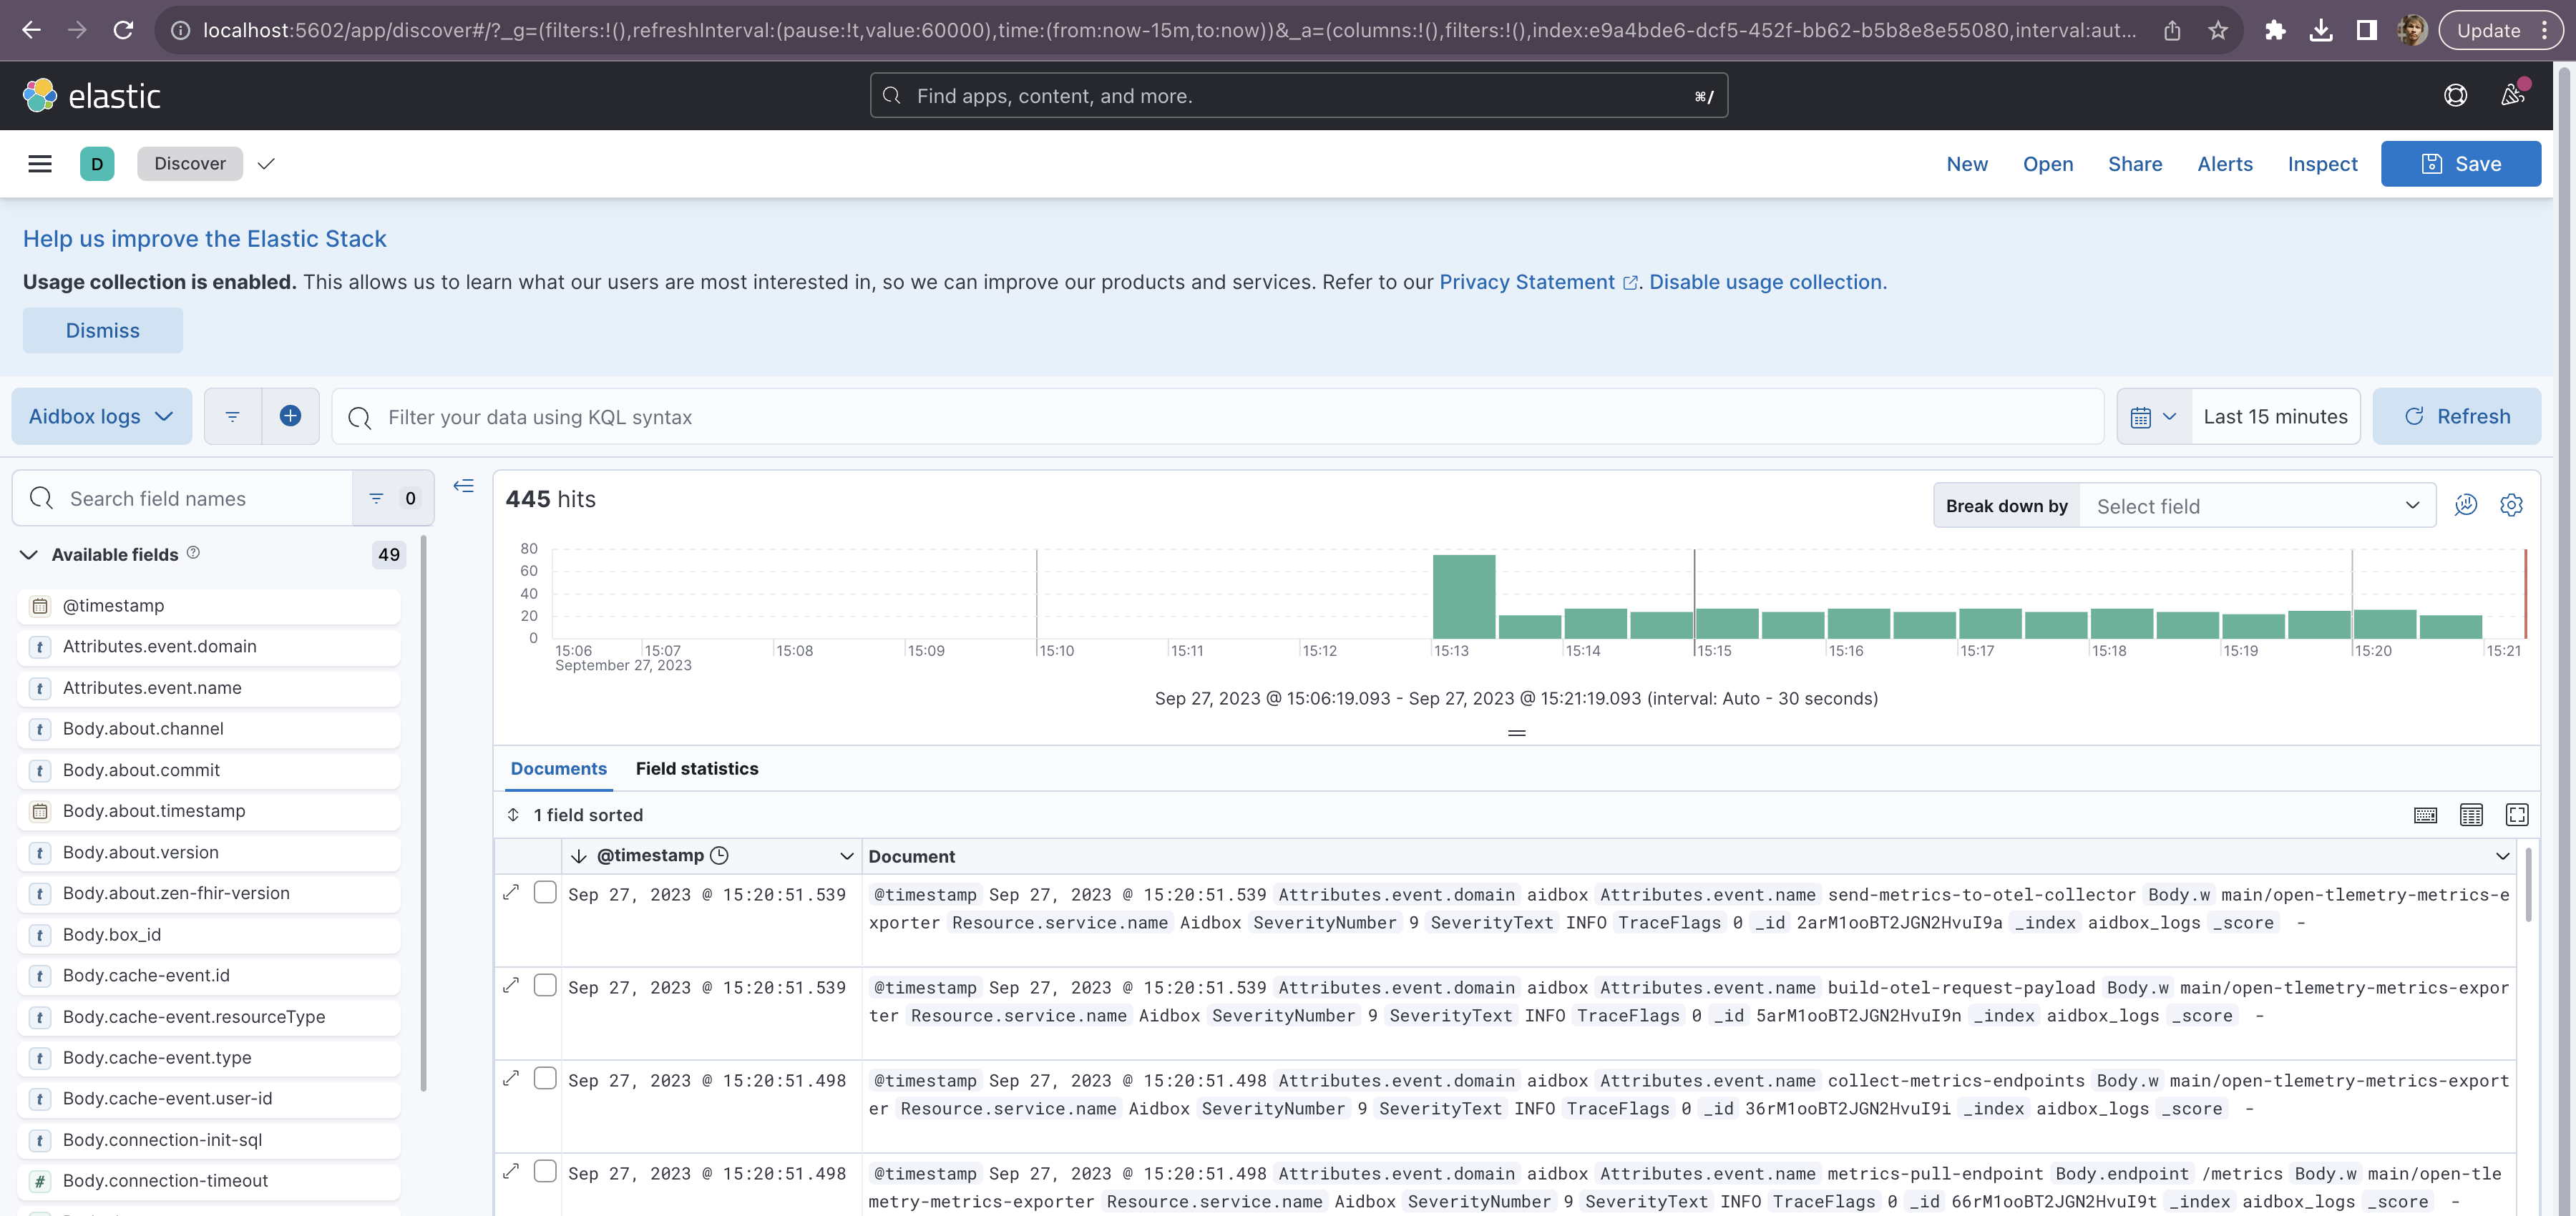
4. Discover Aidbox metrics with Prometheus
Prometheus should be available on http://localhost:9090 address. To see metrics in Prometheus we should open it and search for it.
Prometheus UI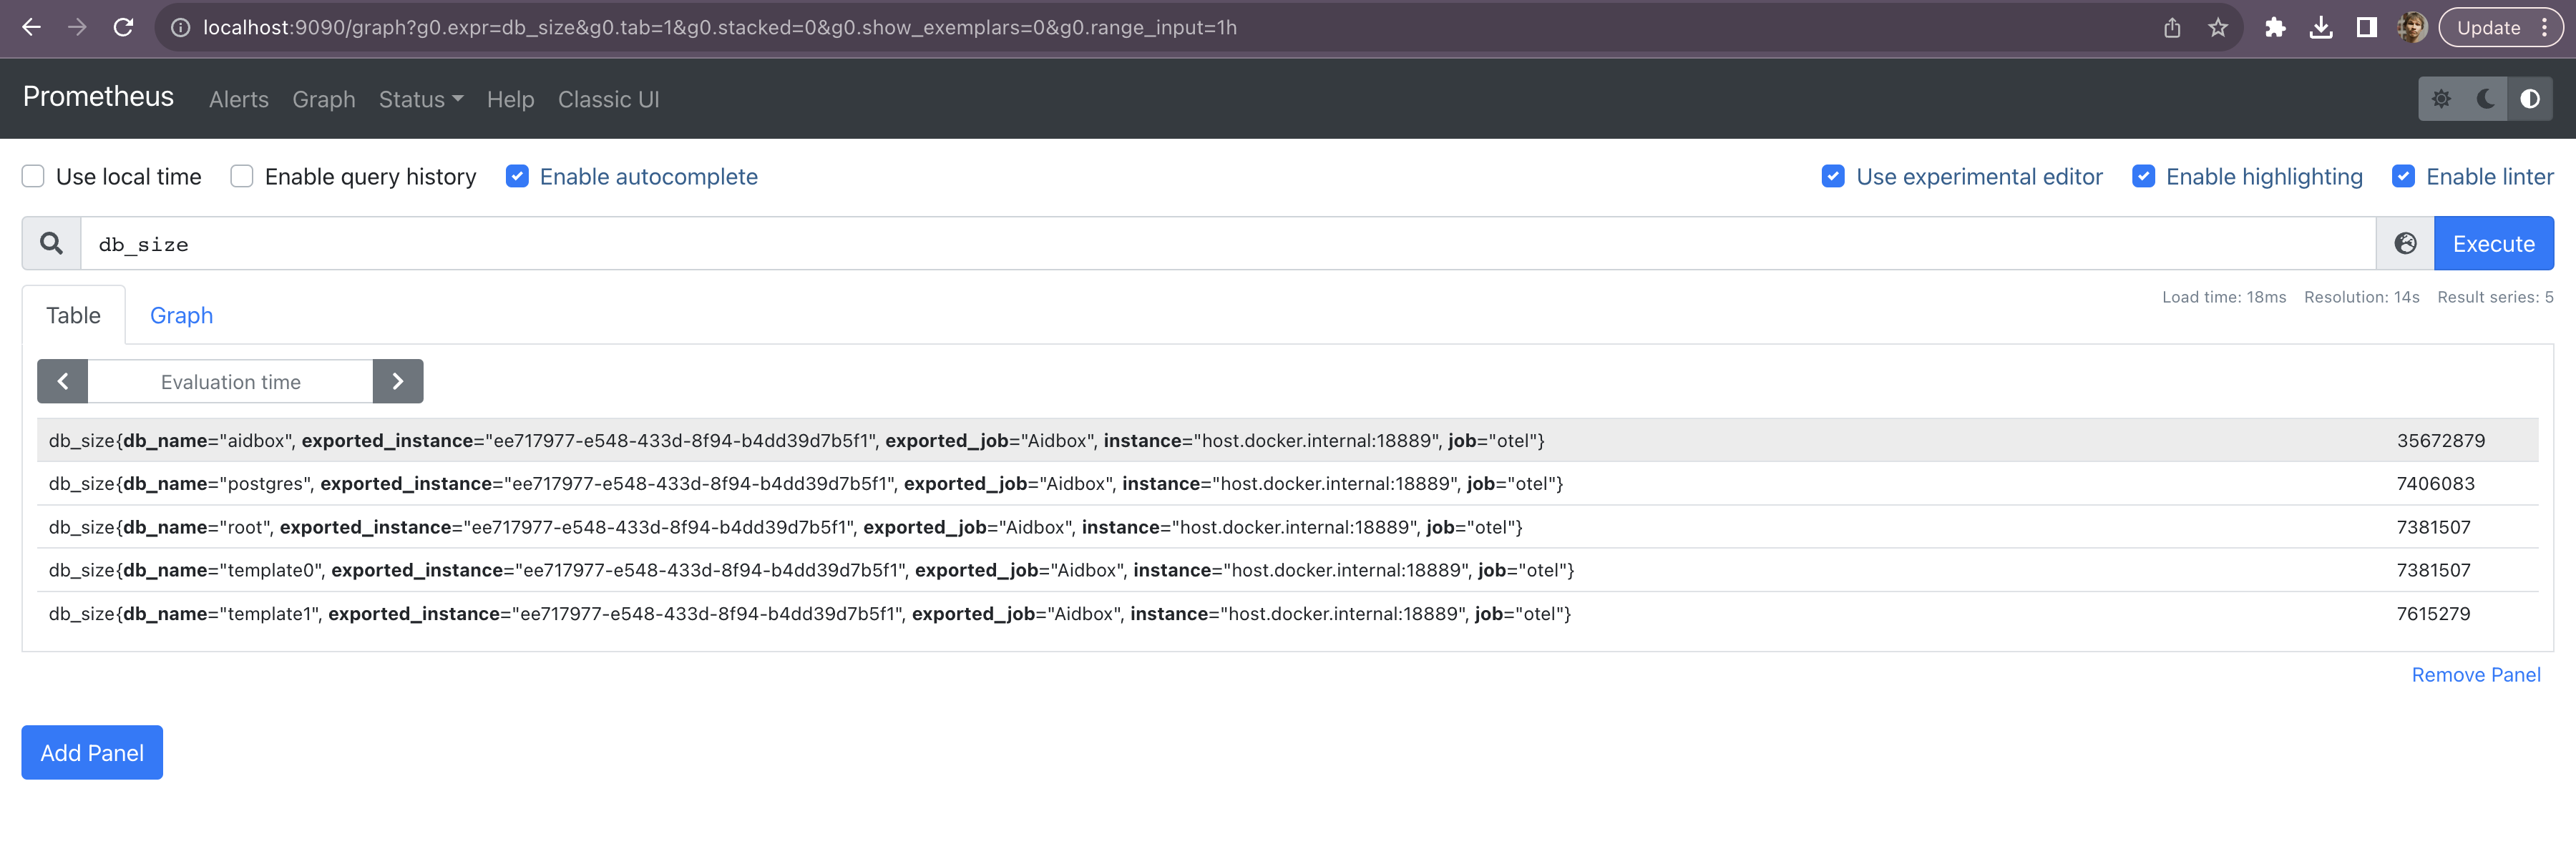
5. Discover Aidbox traces with Zipkin
Zipkin should be available on http://localhost:9411/ address. To see traces in Zipkin click the Run query button.
Traces list in Zipkin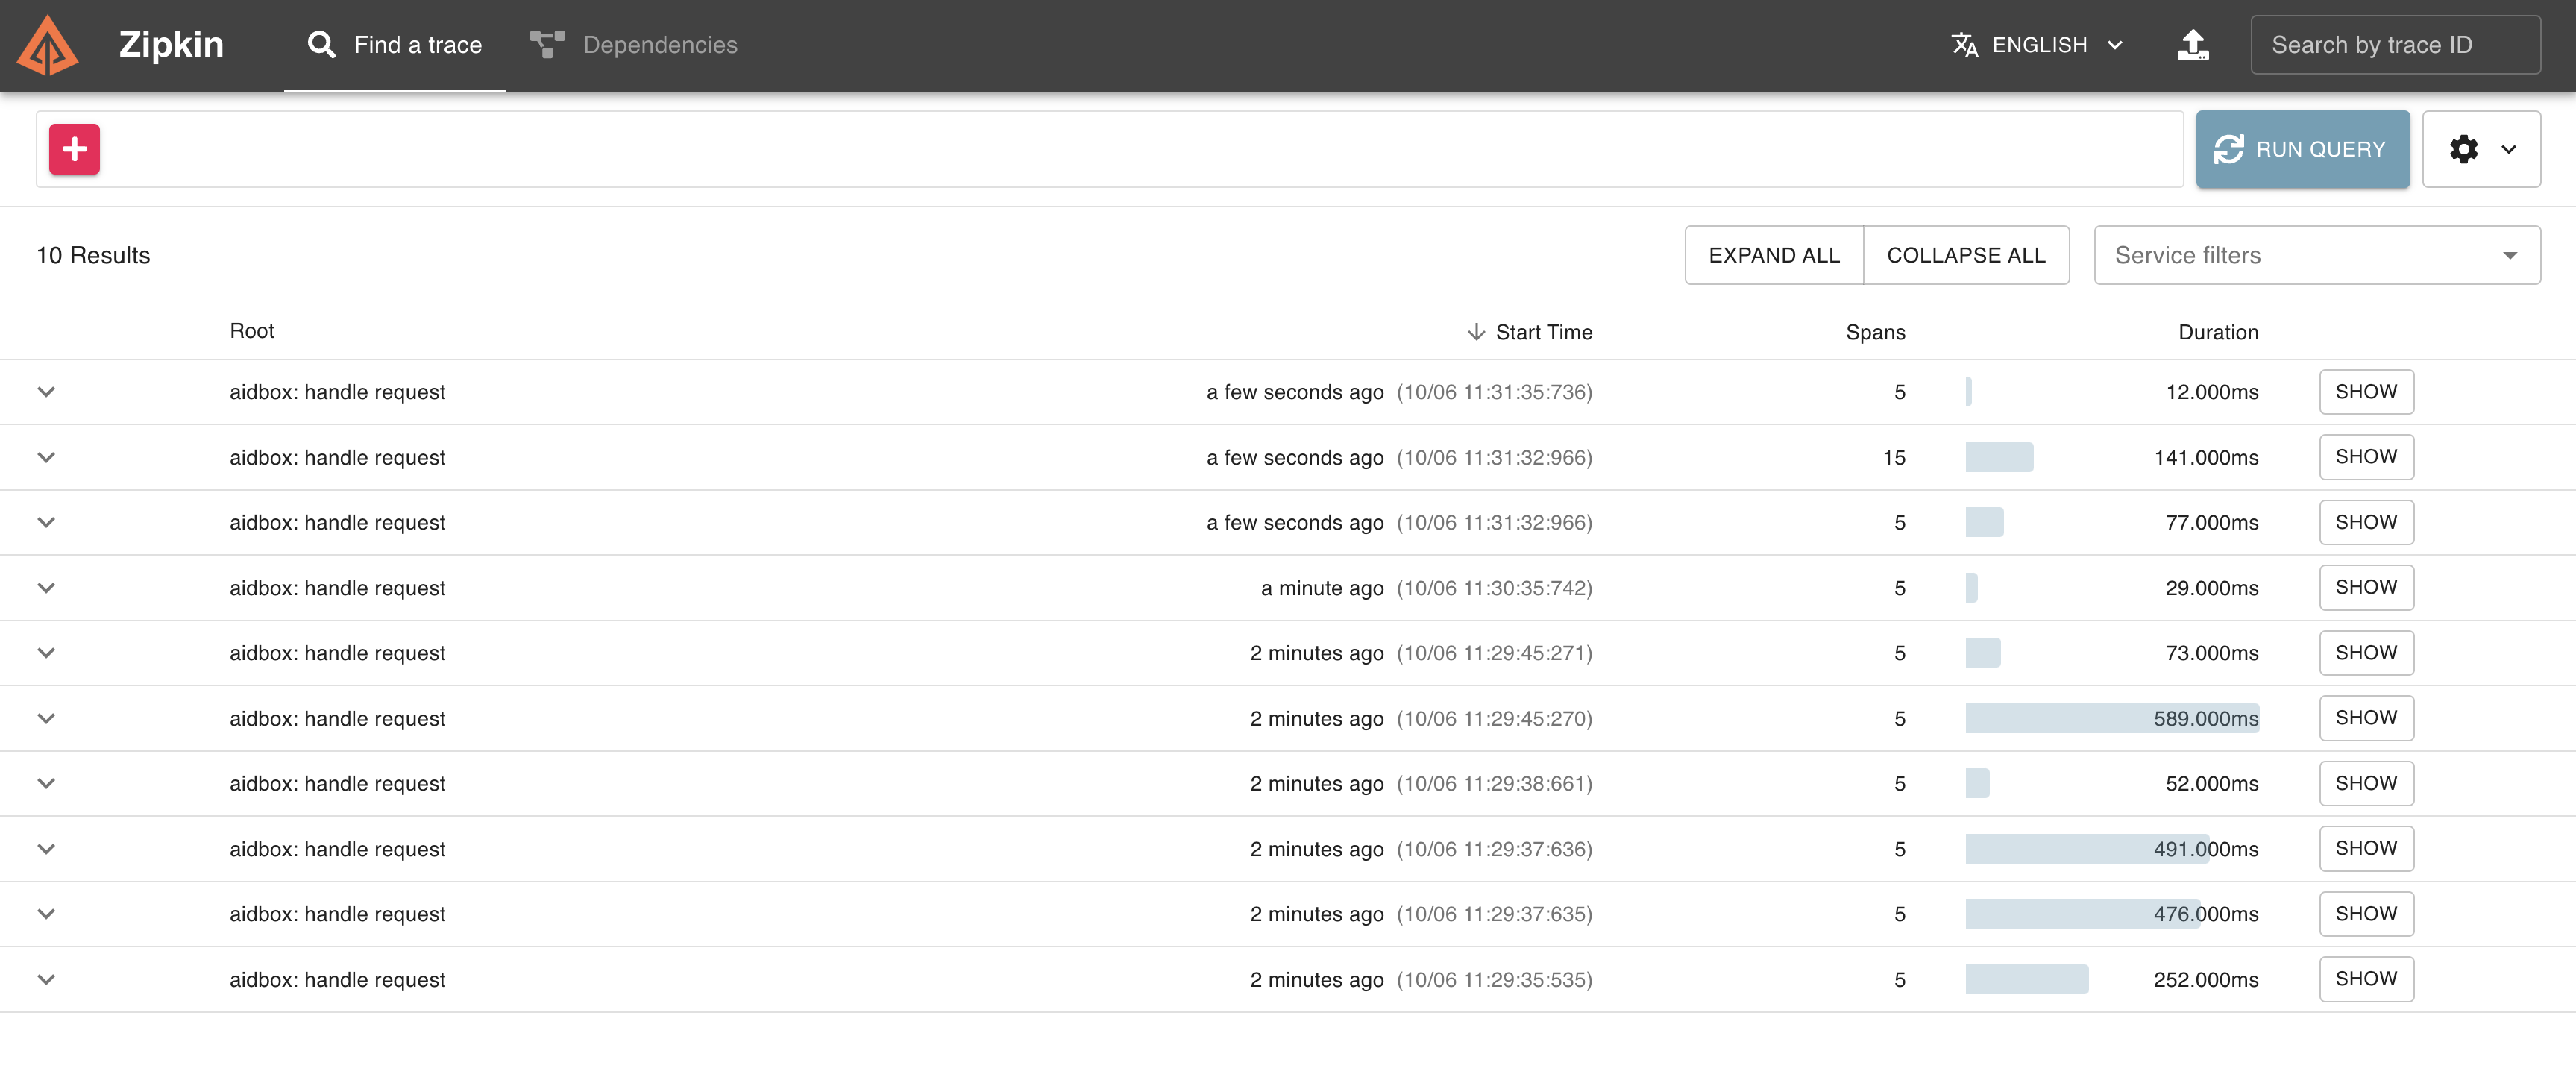
Click the Show button to see all spans of a certain request.
Trace view in Zipkin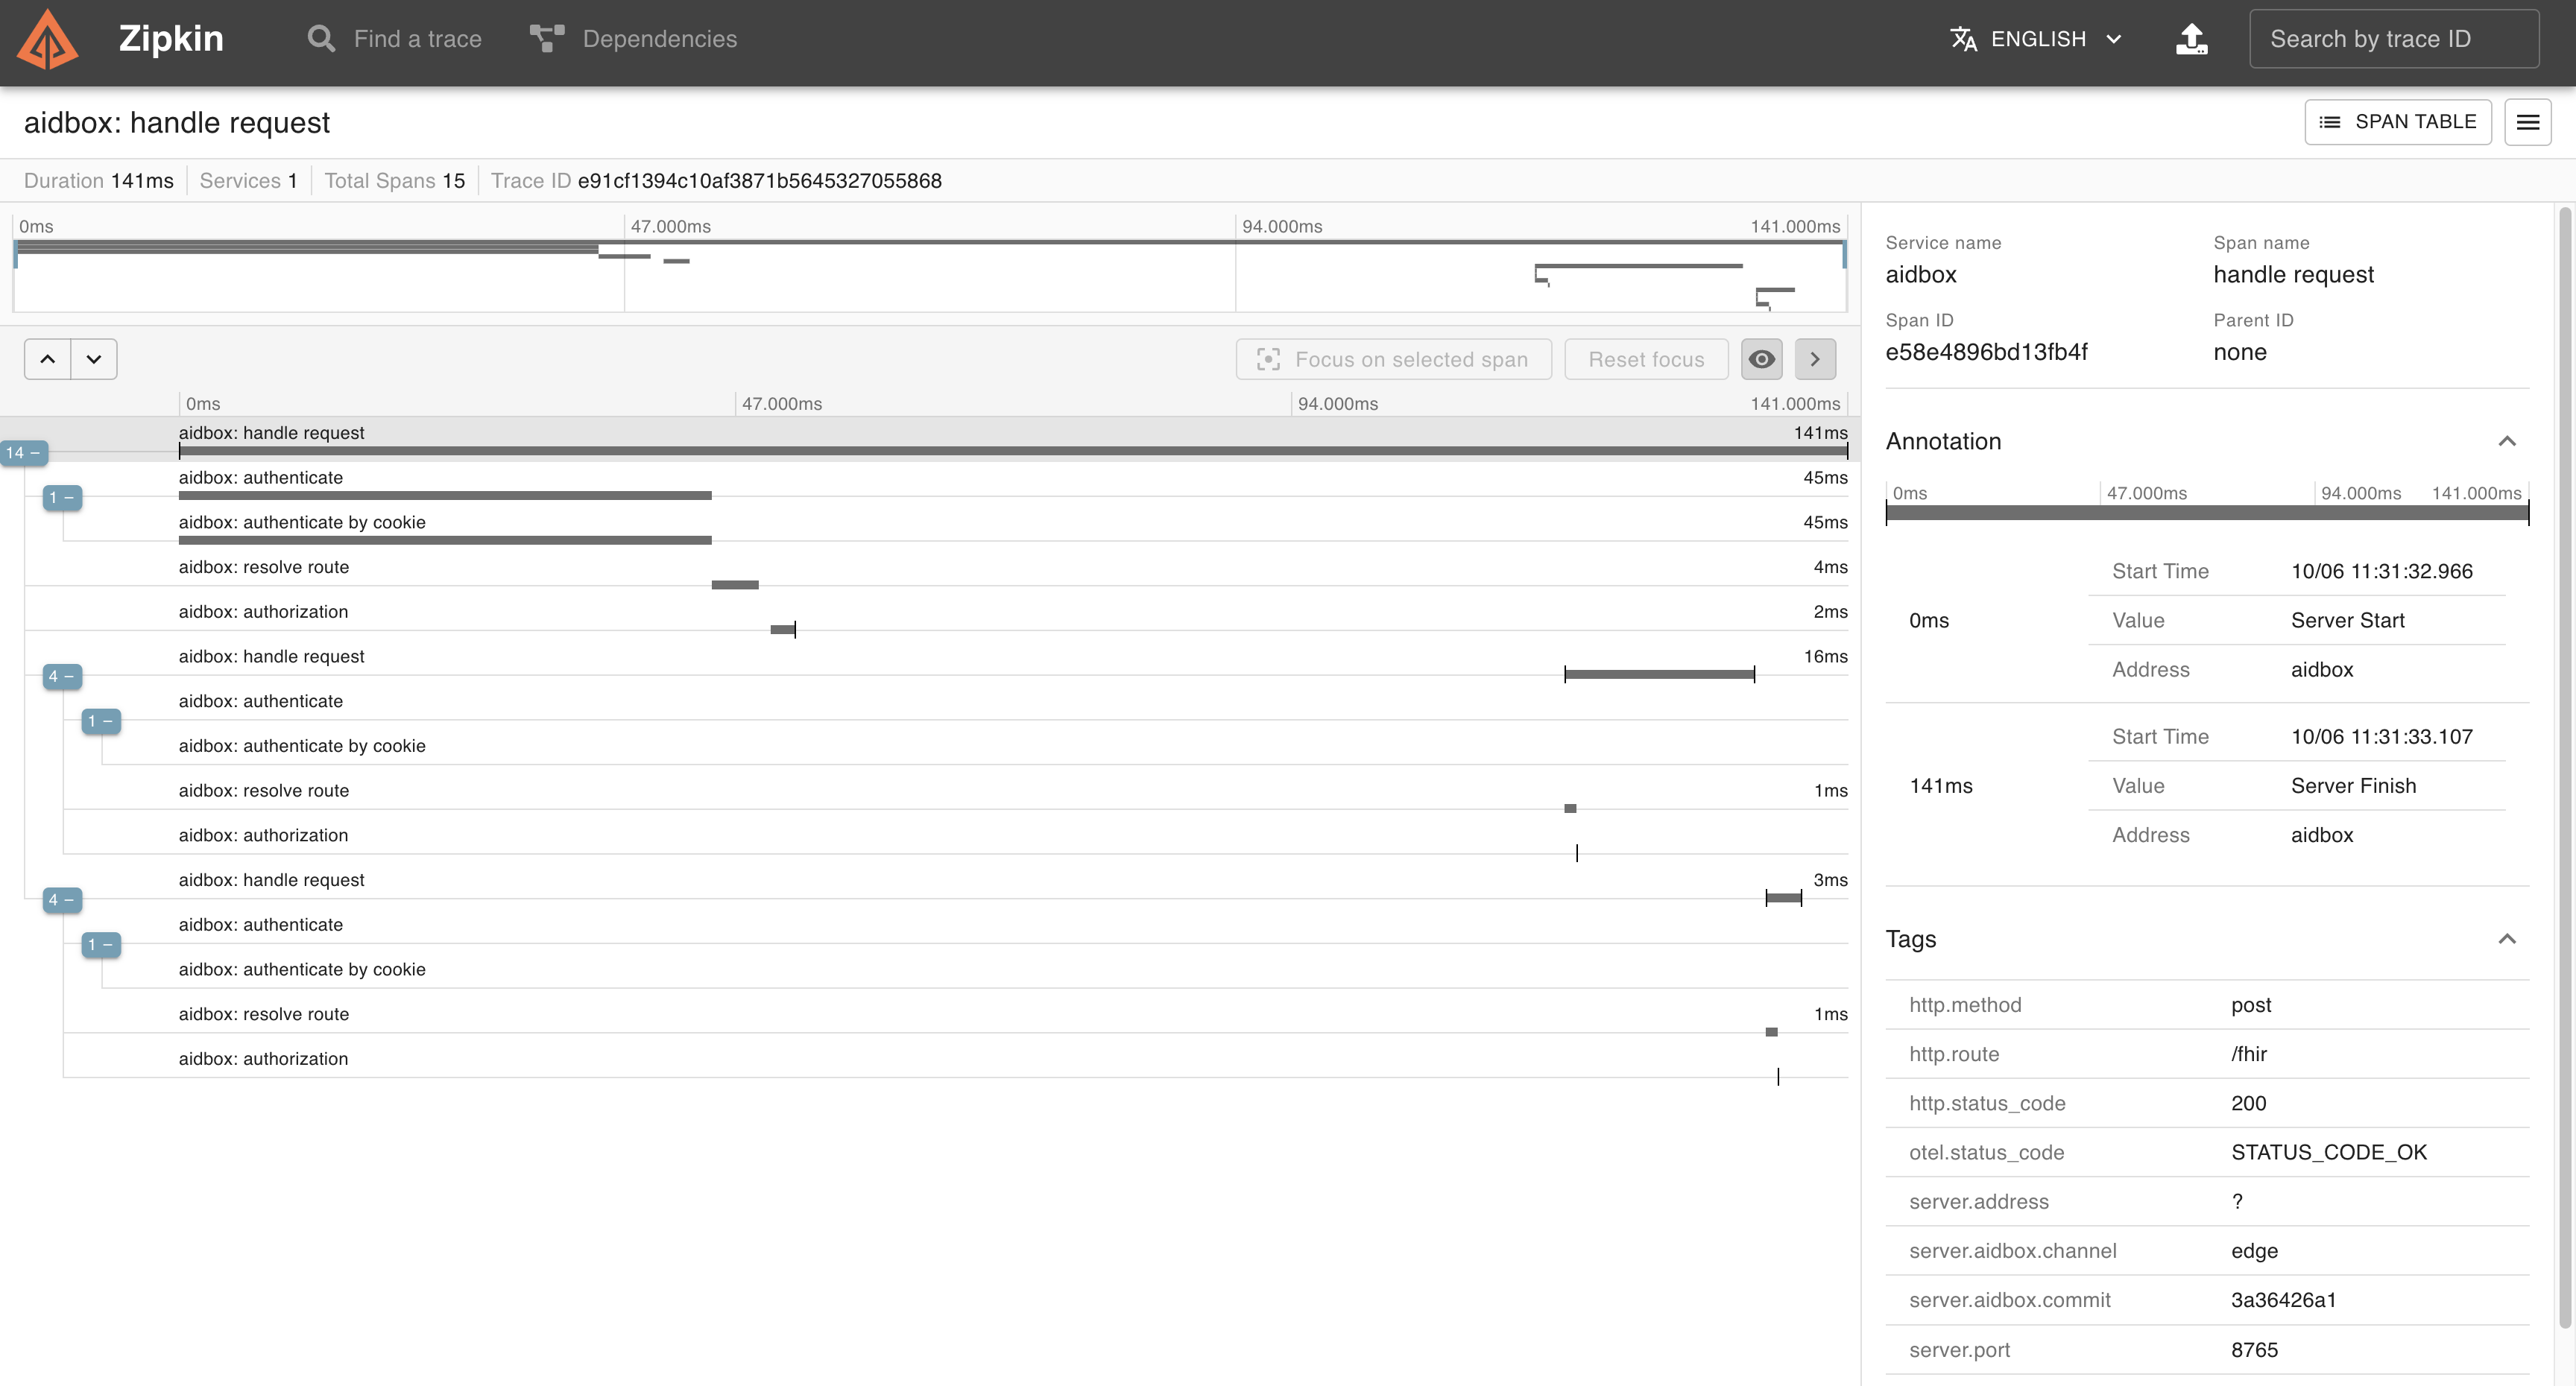
Next Steps
- Learn more about Aidbox Configuration